eInvoicing growth metrics
The latest eInvoicing statistics for February 2024.
View image description
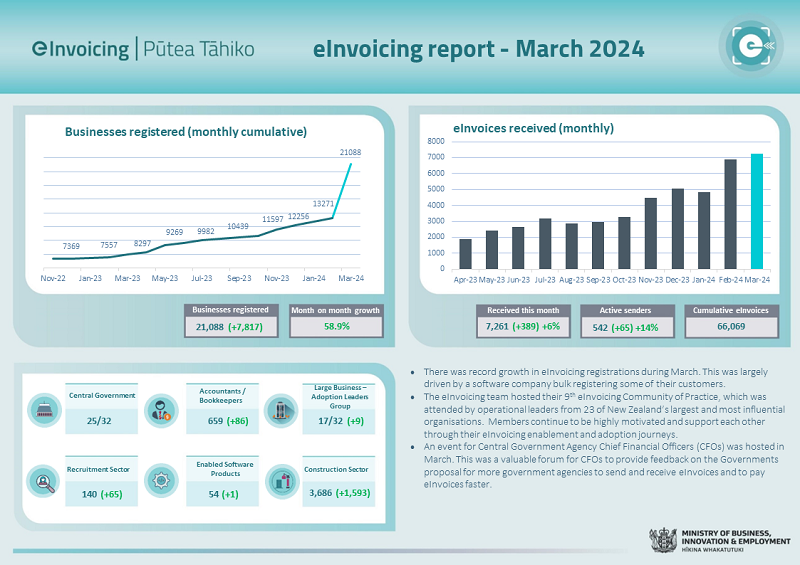
eInvoicing report graphic for March 2024 showing 2 charts, an infographic and summary text:
- Top left – A line chart showing the monthly cumulative businesses registered to receive eInvoices
- Top right – A bar chart showing monthly eInvoices received across the Peppol network
- Bottom left – Infographic showing the number of businesses registered to receive eInvoices for key sectors/groups
- Bottom right – summary text.
View larger versions of the charts and their corresponding data below.
Summary
-
There was record growth in eInvoicing registrations during March. This was largely driven by a software company bulk registering some of their customers.
-
The eInvoicing team hosted their 9th eInvoicing Community of Practice, which was attended by operational leaders from 23 of New Zealand’s largest and most influential organisations. Members continue to be highly motivated and support each other through their eInvoicing enablement and adoption journeys.
-
An event for Central Government Agency Chief Financial Officers (CFOs) was hosted in March. This was a valuable forum for CFOs to provide feedback on the Governments proposal for more government agencies to send and receive eInvoices and to pay eInvoices faster.
Businesses registered (monthly cumulative)
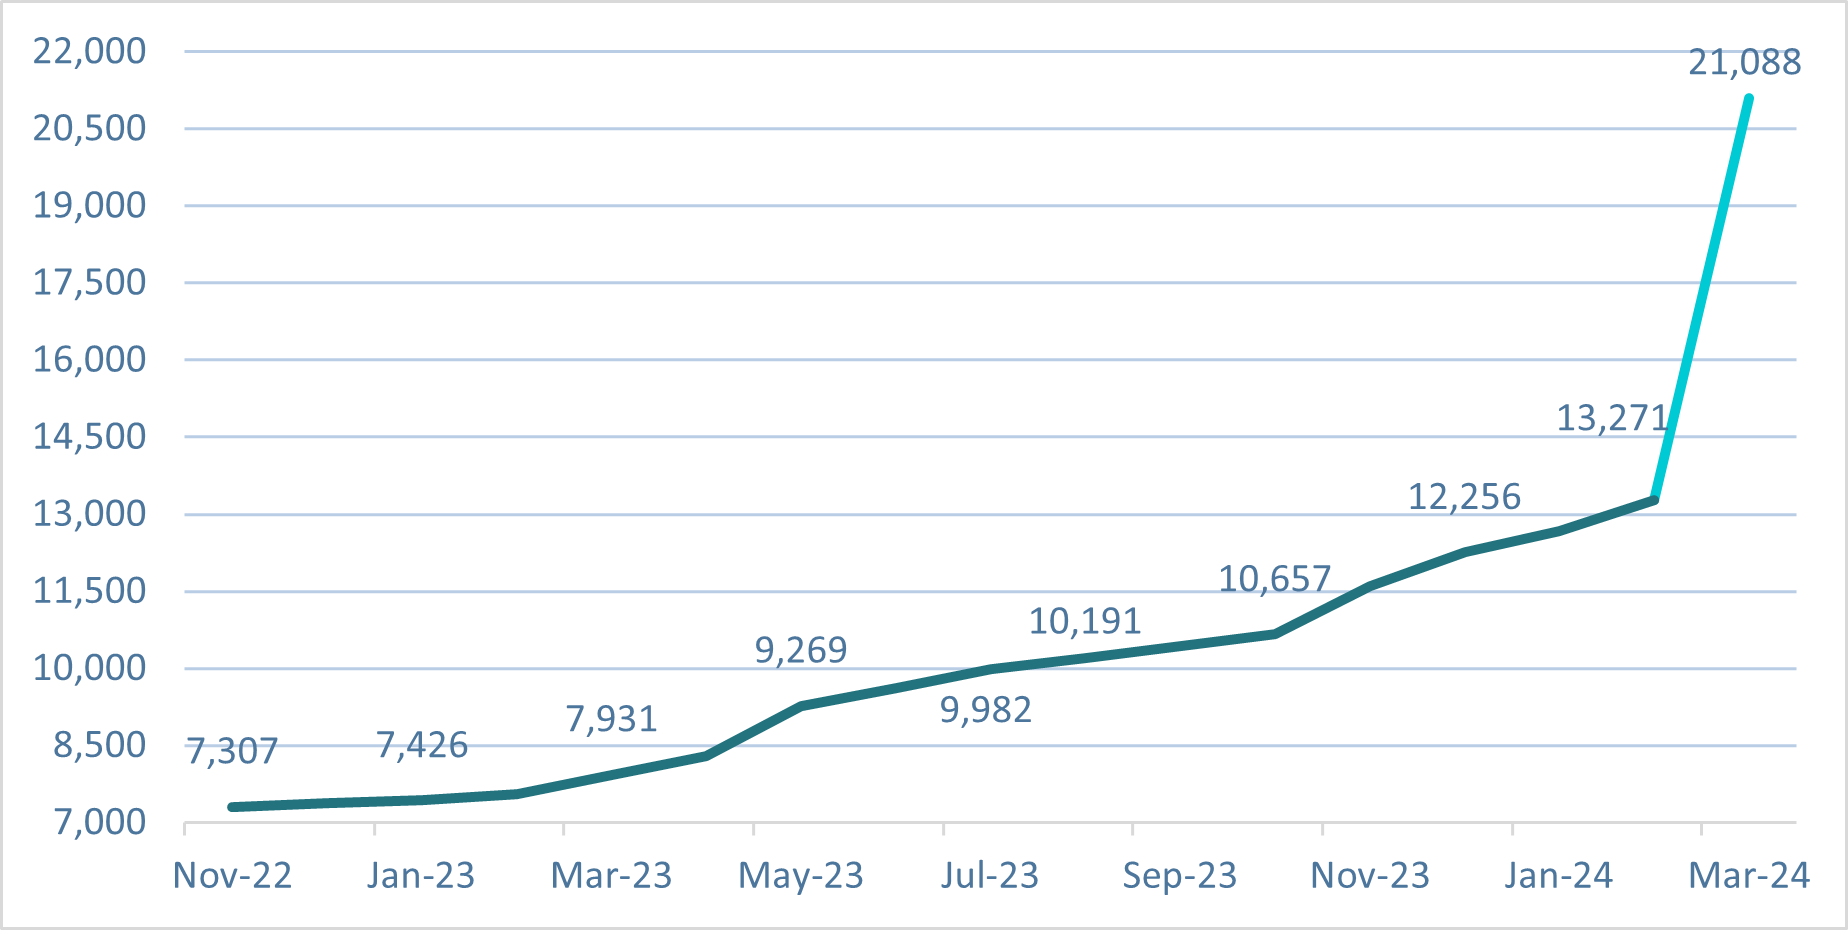
- New businesses registered: 20,088 (+7,817)
- Month-on-month growth: 58.9%
View chart description and data
A line chart that shows businesses registered from November 2022 to March 2024.
| Month |
Per month |
Cumulative |
| November 2022 |
172 |
7,307 |
| December 2022 |
62 |
7,369 |
| January 2023 |
57 |
7,426 |
| February 2023 |
131 |
7,557 |
| March 2023 |
374 |
7,931 |
| April 2023 |
366 |
8,297 |
| May 2023 |
972 |
9,269 |
| June 2023 |
339 |
9,608 |
| July 2023 |
374 |
9,982 |
| August 2023 |
209 |
10,191 |
| September 2023 |
248 |
10,439 |
| October 2023 |
218 |
10,657 |
| November 2023 |
940 |
11,597 |
| December 2023 |
569 |
12,256 |
| January 2024 |
423 |
12,679 |
| February 2024 |
592 |
13,271 |
| March 2024 |
7,817 |
21,088 |
eInvoices received (monthly)
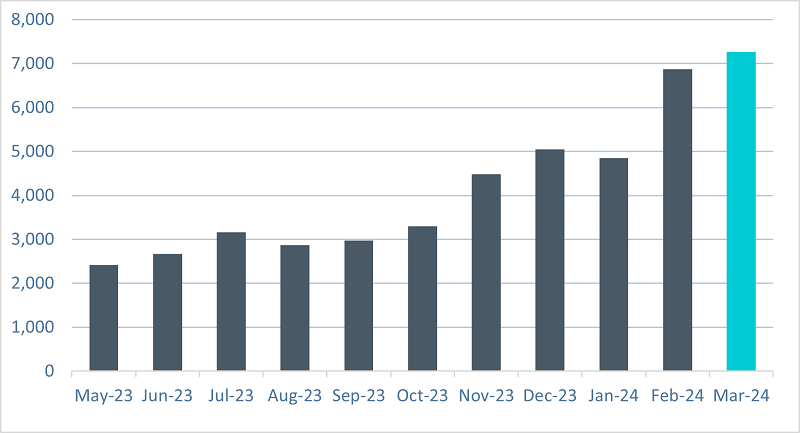
- Recieved this month: 7,621 (+389) +6%
- Active senders: 542 (+65) +14%
- Cumulative eInvoices received: 66,069
View chart description and data
A bar chart that shows eInvoices received from April 2023 to March 2024.
| Period |
Quantity |
Movement |
Volume growth |
Cumulative |
| April 2023 |
1,874 |
39 |
+2% |
20,173 |
| May 2023 |
2,423 |
549 |
+29% |
22,596 |
| June 2023 |
2,667 |
244 |
+10% |
25,263 |
| July 2023 |
3,164 |
497 |
+19% |
28,427 |
| August 2023 |
2,865 |
287 |
+11% |
31,292 |
| September 2023 |
2,975 |
110 |
+4% |
34,267 |
| October 2023 |
3,296 |
321 |
+11% |
37,563 |
| November 2023 |
4,482 |
1,186 |
+36% |
42,045 |
| December 2023 |
5,051 |
569 |
+13% |
47,096 |
| Janauary 2024 |
4,851 |
-189 |
-16% |
51,936 |
| February 2024 |
6,872 |
-2021 |
+42% |
58,808 |
| March 2024 |
7,261 |
+386 |
+6% |
66,069 |
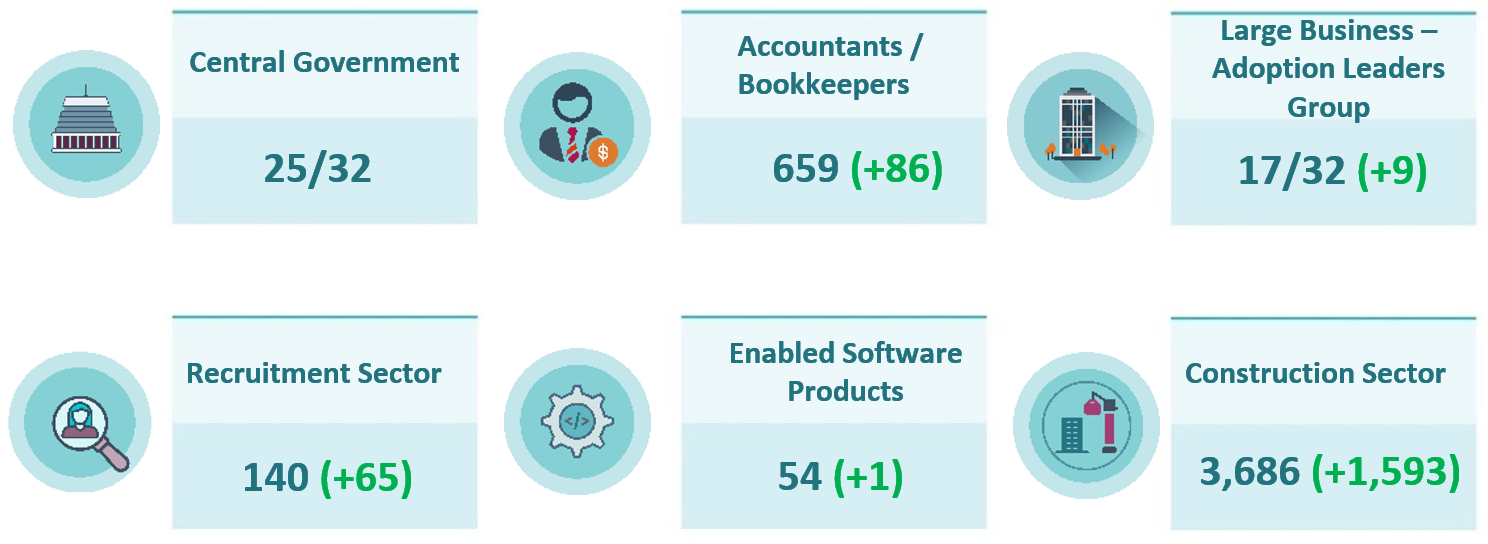
Central government agencies and businesses registered to receive eInvoices
View infographic description and data
Infographic showing the number of central government agencies and businesses registered to receive eInvoices for key sectors/groups for March 2024:
- Central government: 25 of 32
- Accountants/bookkeepers: 659 (+86)
- Large Business Adoption Leader’s Group: 17 of 32 (+9)
- Recruitment sector: 140 (+65)
- Enabled software products: 54 (+1)
- Construction sector: 3,686 (+1,539)
Sign up, to stay ahead
If you’re a business owner, accountant, business advisor or manager – or you just want to stay in front of the eInvoicing curve – sign up here for email updates, seminar/webinar invitations, and tips to get maximum value from eInvoicing.
Subscribe
Last updated: 16 April 2024