eInvoicing growth metrics
The latest eInvoicing statistics for July 2026.
On this page I tēnei whārangi
View image description
View larger versions of the charts and their corresponding data below.
Summary
- Over 113,000 New Zealand businesses are registered to receive eInvoices following completion of bulk registrations by a major accounting software provider.
- Fire and Emergency New Zealand's received the latest quarterly eInvoicing Excellence Award from the Ministry of Business, Innovation and Employment (MBIE) Chief Executive. Their efforts demonstrate how targeted supplier onboarding and internal advocacy can deliver standout results.
- The eInvoicing Adoption Leaders Group met in early June, bringing together senior finance and digital leaders from New Zealand and Australia. The Minister for Small Business and Manufacturing also attended. The forum provides a valued opportunity to share ways to accelerate eInvoicing adoption in NZ.
- A new series of webinars begins in late July to support businesses, agencies, accountants, bookkeepers and advisers to make the most of eInvoicing. Find out more here.
Note: to allow timely publishing of this report, the monthly eInvoices received and active users graphs report data from the previous month.
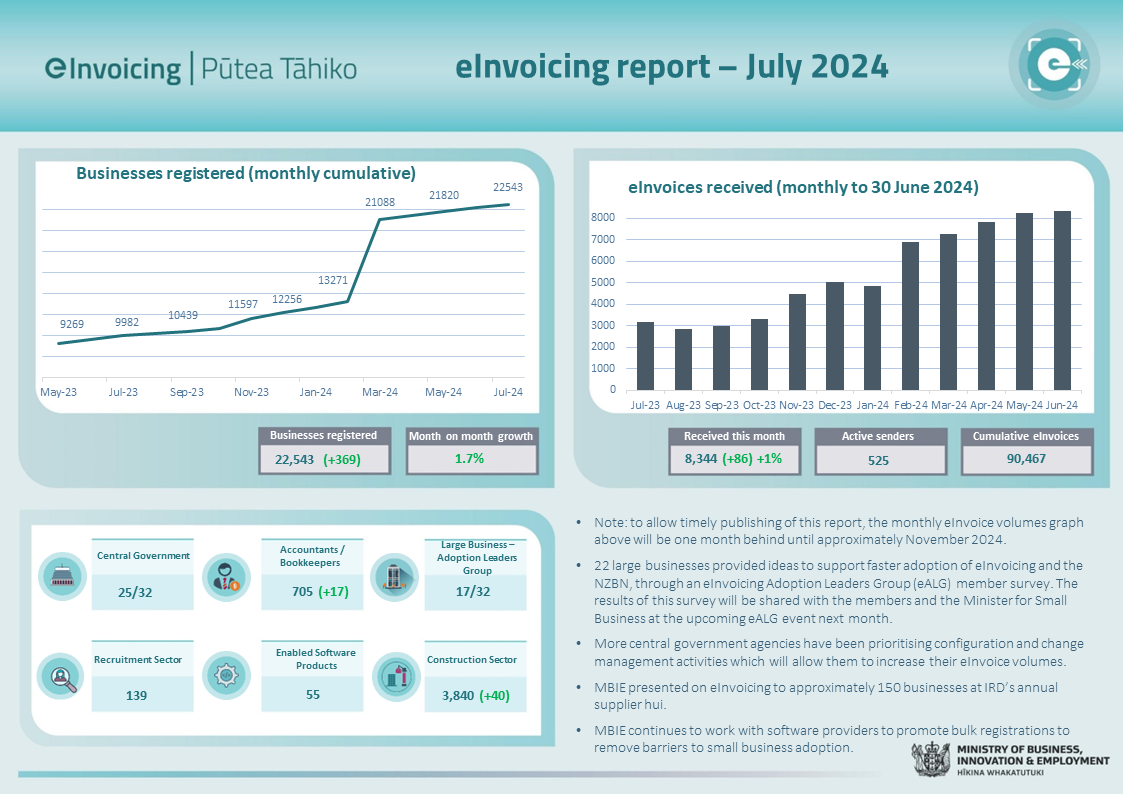
Total registrations to date
- New businesses registered: 113,868
- Monthly change: 49,994
eInvoices received (monthly)
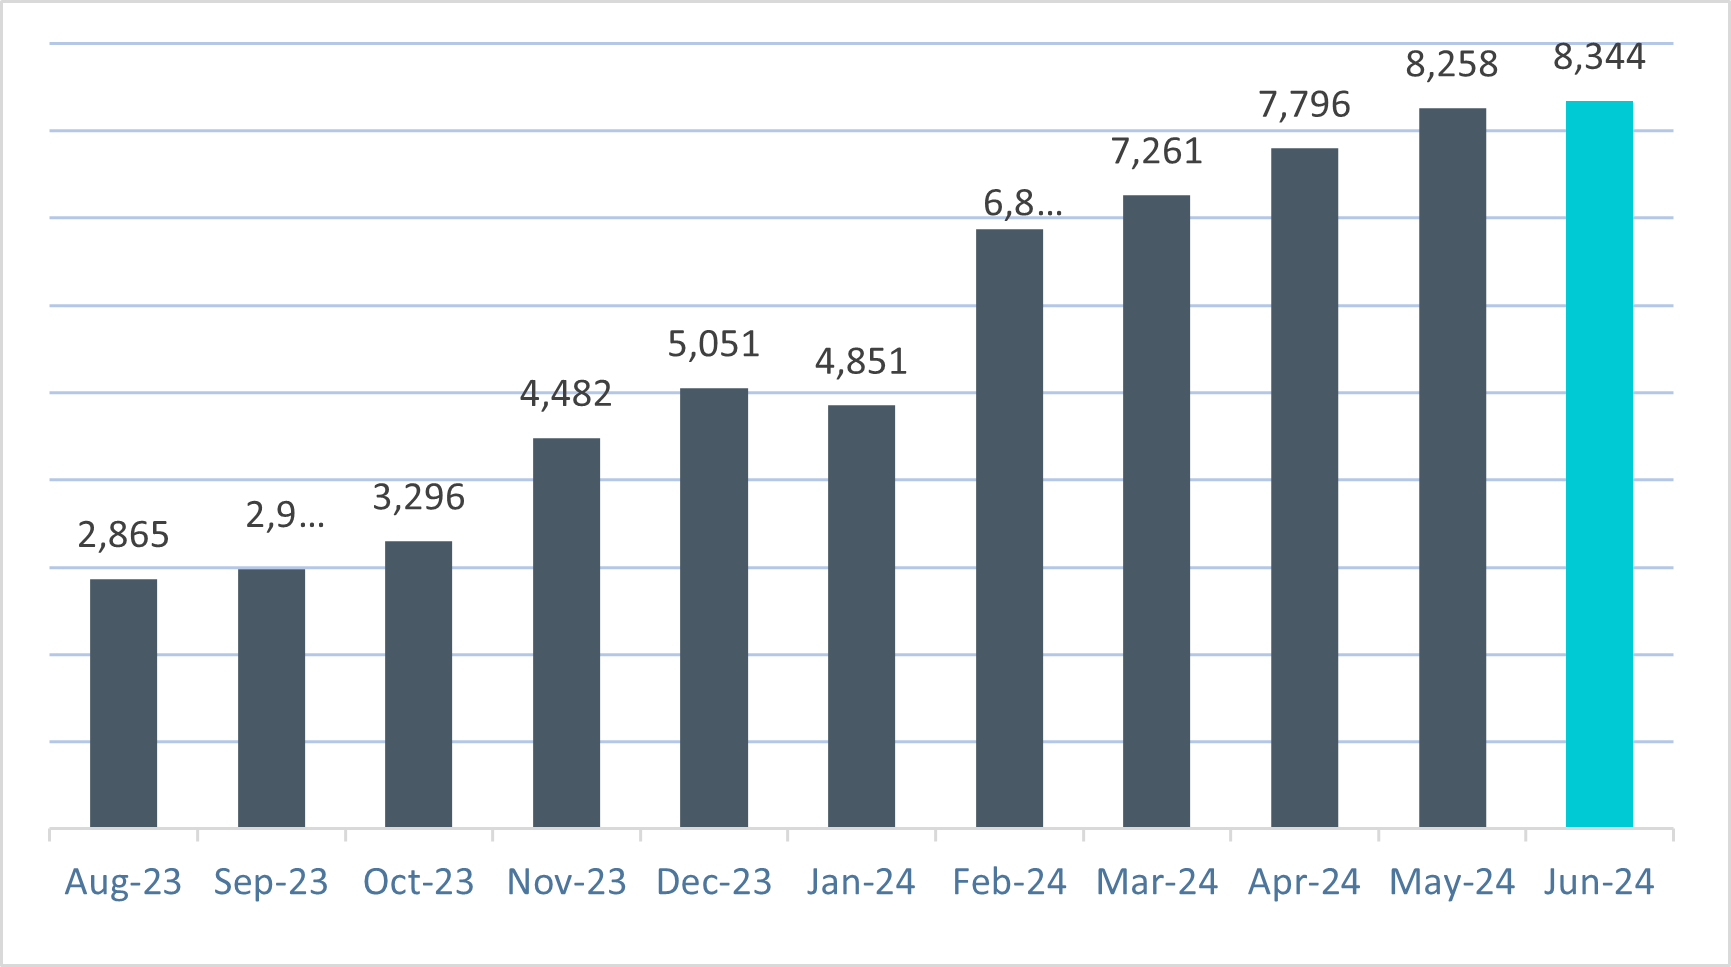
- Received this month: 54,254 (+1,864)
-
Cumulative eInvoices received: 958,848
View chart description and data
Central government agencies and businesses registered to receive eInvoices
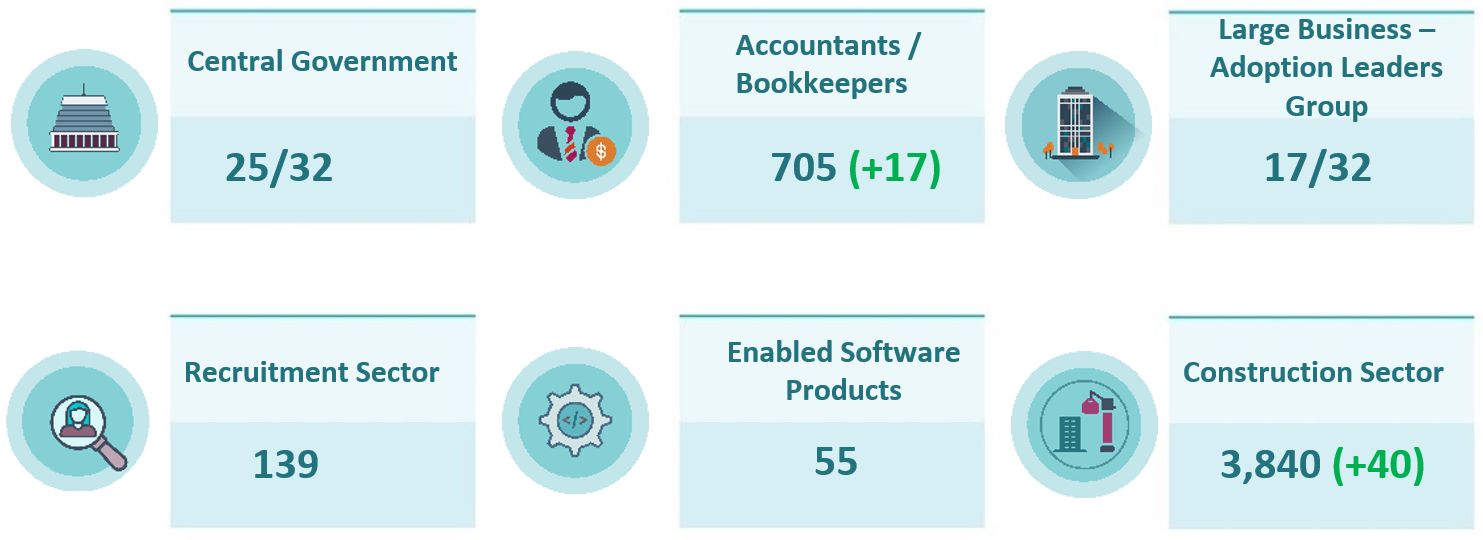
View infographic description and data
Active Users (monthly)
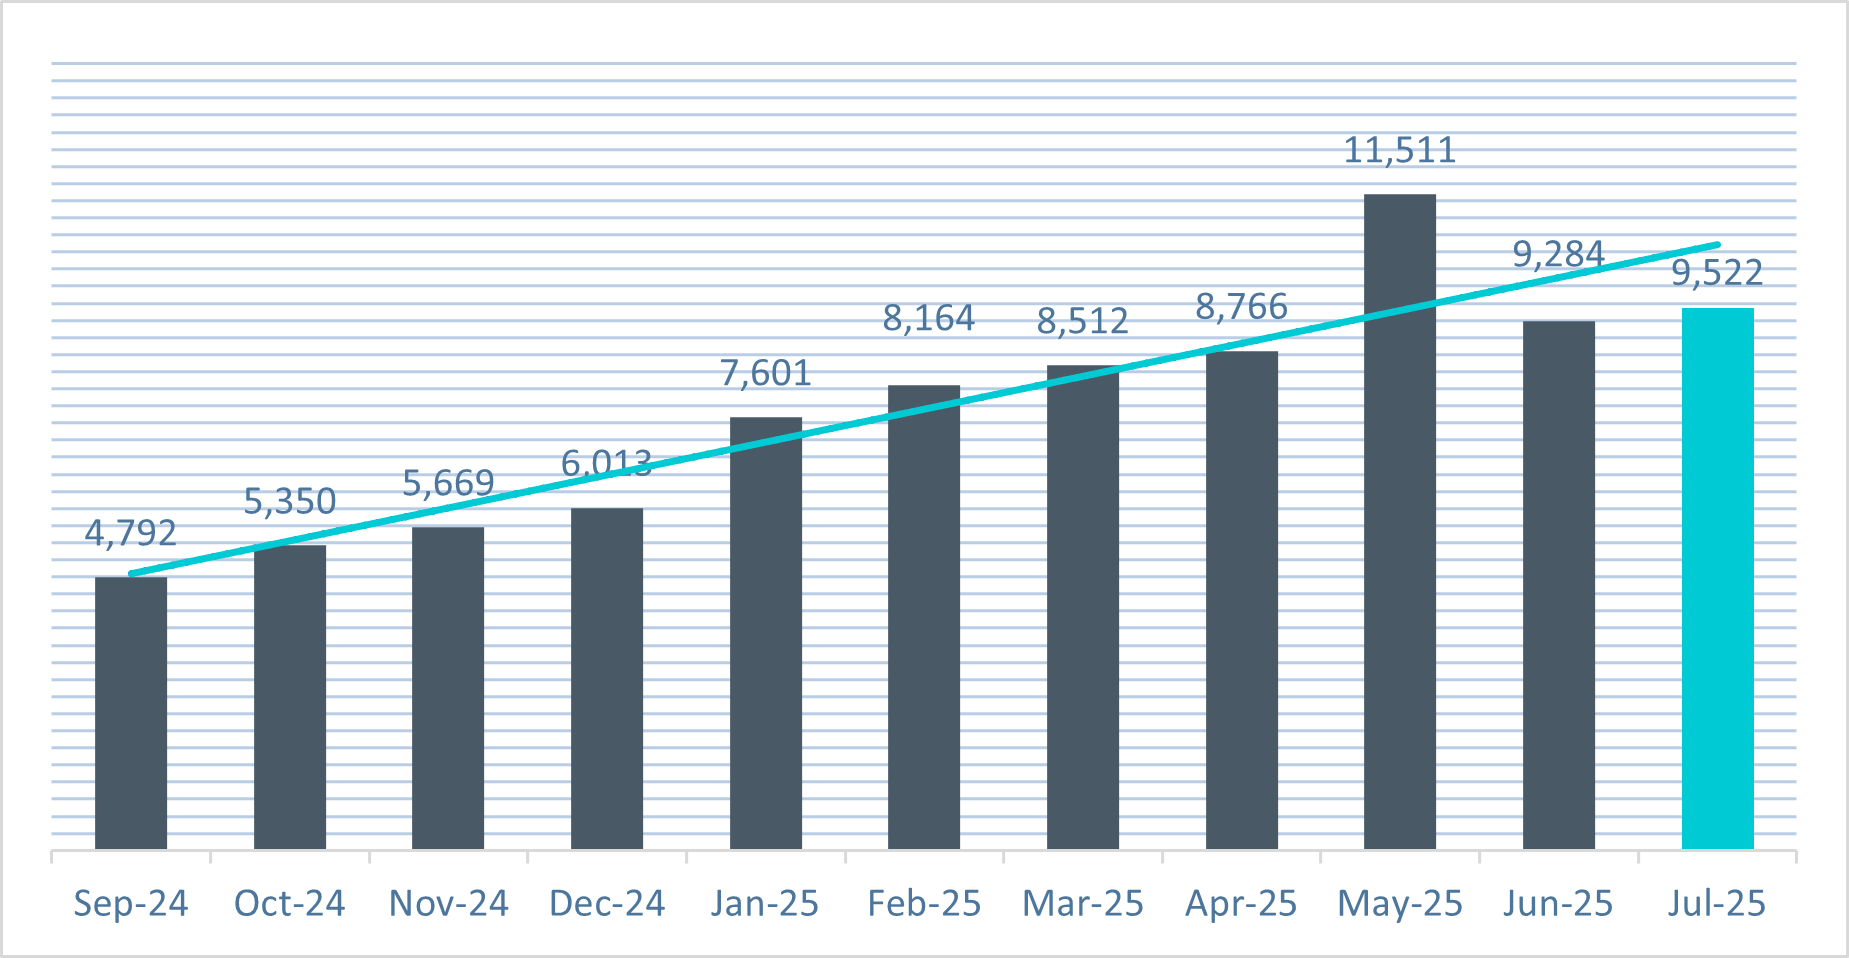
View chart description and data
Sign up, to stay ahead
If you’re a business owner, accountant, business advisor or manager – or you just want to stay in front of the eInvoicing curve – sign up here for email updates, seminar/webinar invitations, and tips to get maximum value from eInvoicing.