eInvoicing growth metrics
The latest eInvoicing statistics for April 2025.
On this page
View image description
View larger versions of the charts and their corresponding data below.
Summary
- Public consultation on proposed Government Procurement Rules, including new rules on eInvoicing and prompt payment times, closed on 8 April 2025. Feedback has been consolidated and will be considered by Cabinet as part of the wider rules review process.
- The 12th eInvoicing Community of Practice (eCoP) meeting was hosted by Westpac NZ and was attended by representatives from 19 large businesses. The group discussed topics of standardisation, proposed policy changes and celebrated the success of a large bank that recently went live with eInvoicing.
- The eInvoicing software developers’ information webpage has recently been updated. It includes extra guidance on developing eInvoicing ‘send’ and ‘receive’ solutions to improve consistency and interoperability of eInvoicing solutions.
Software developers’ information
Note: to allow timely publishing of this report, the monthly eInvoice volumes graph above reports data from the previous month.
Businesses registered (monthly cumulative)
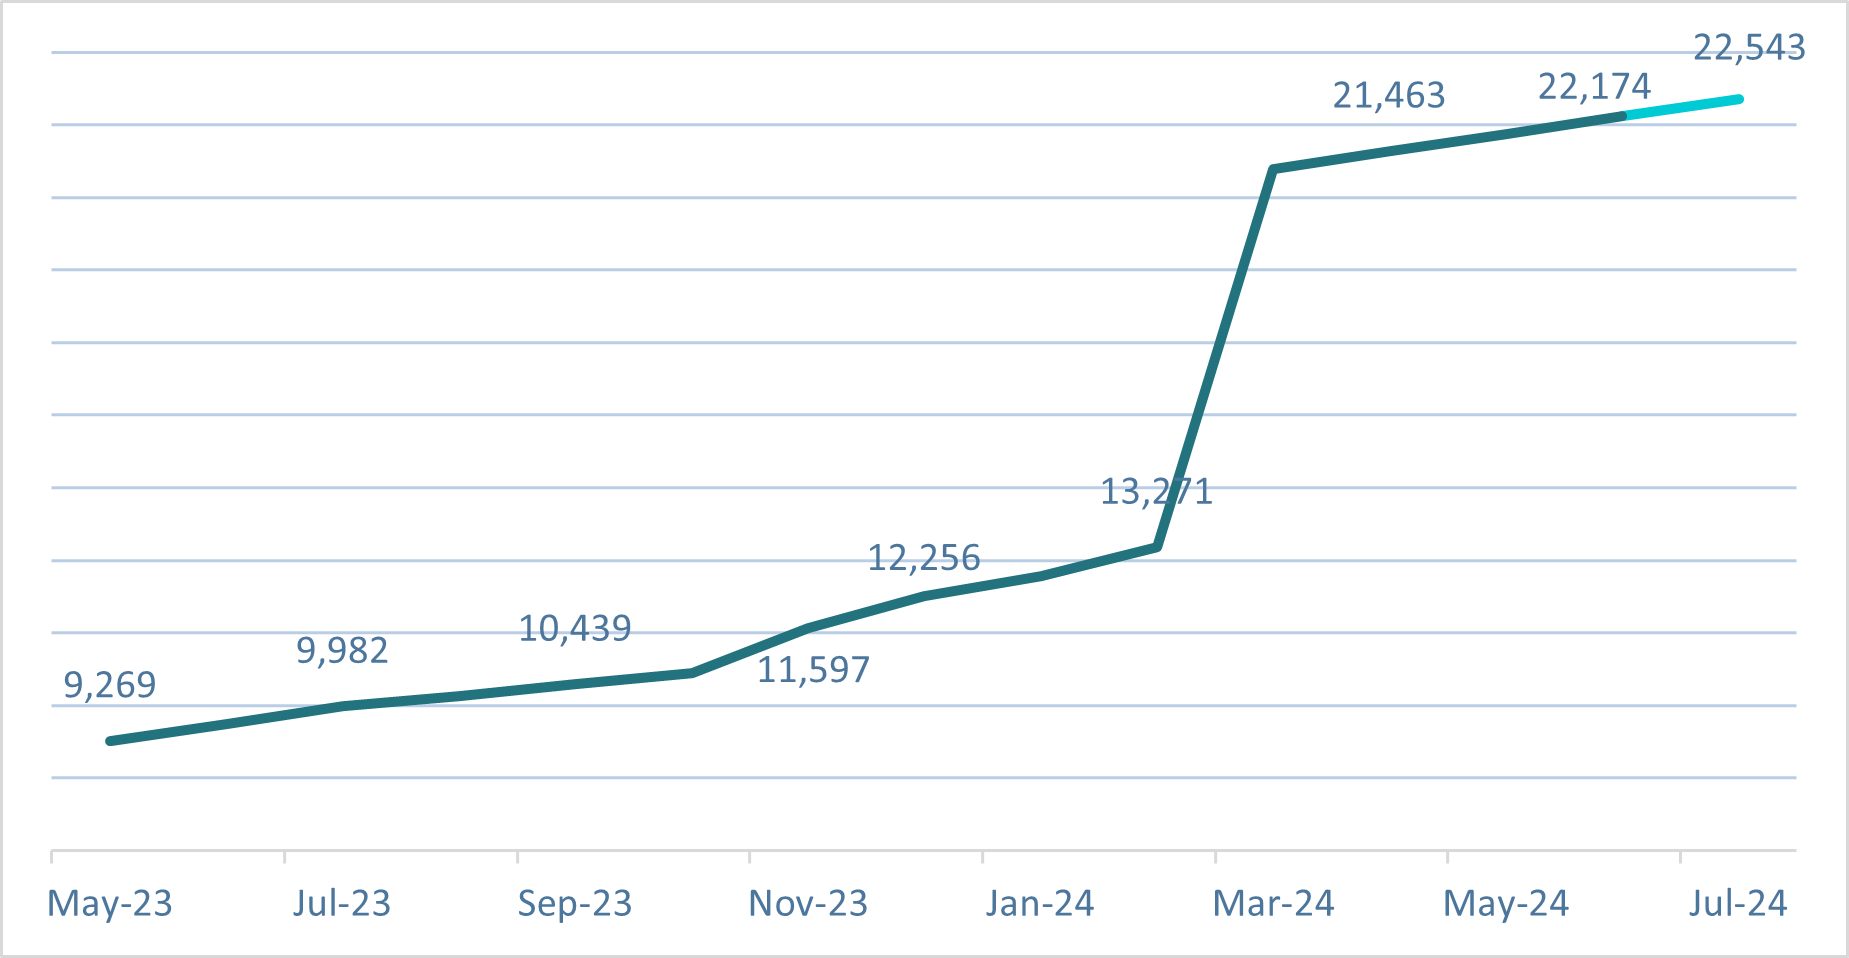
- New businesses registered: 51,381 (+268)
- Month-on-month growth: 0.5%
View chart description and data
eInvoices received (monthly)
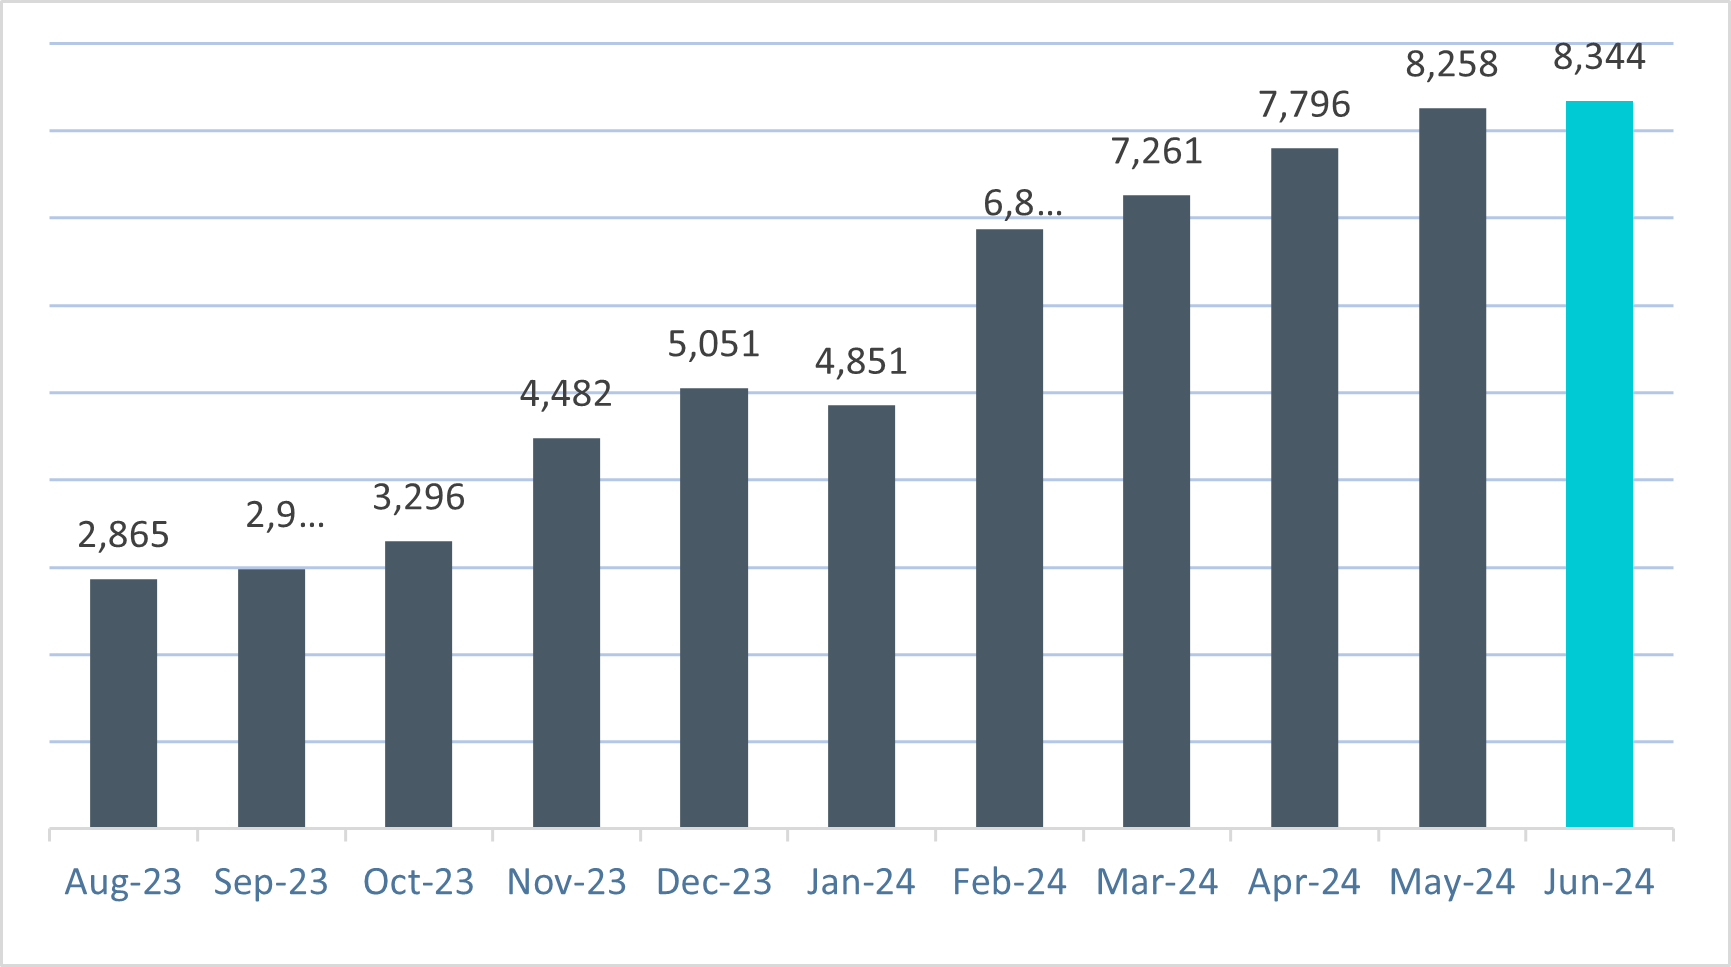
- Received this month: 38,018 (+905) +2%
- Active senders: 8,389 (+293)
- Cumulative eInvoices received: 274,006
View chart description and data
Central government agencies and businesses registered to receive eInvoices
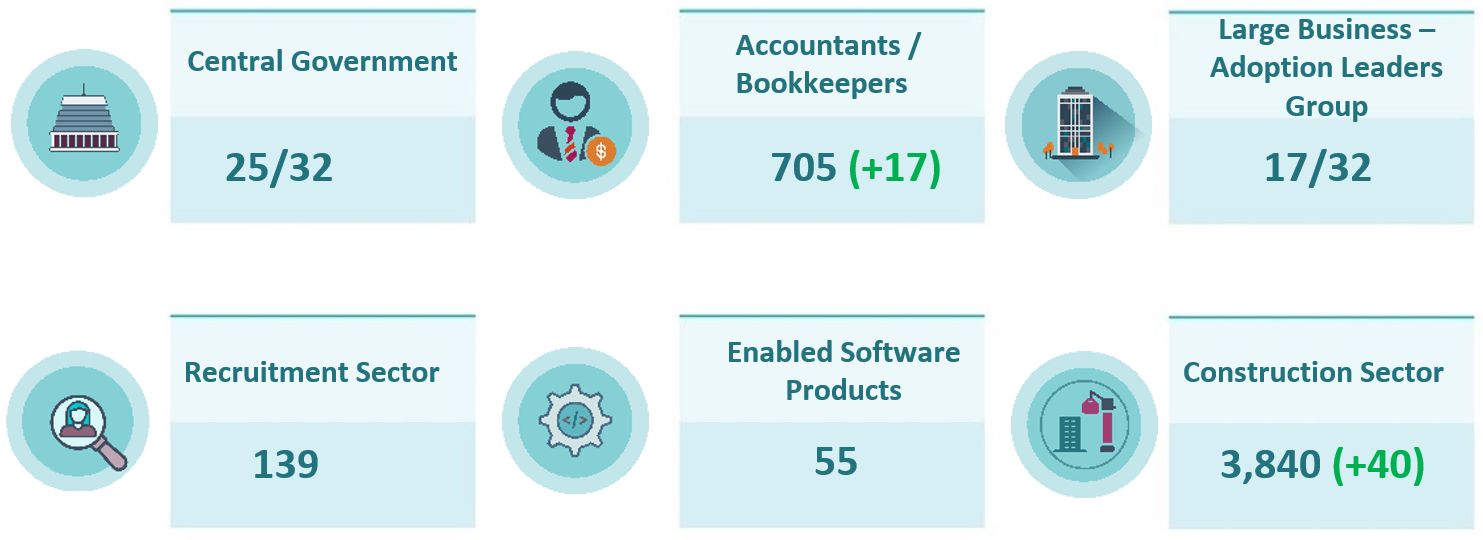
View infographic description and data
Sign up, to stay ahead
If you’re a business owner, accountant, business advisor or manager – or you just want to stay in front of the eInvoicing curve – sign up here for email updates, seminar/webinar invitations, and tips to get maximum value from eInvoicing.
Last updated: 08 May 2025